01
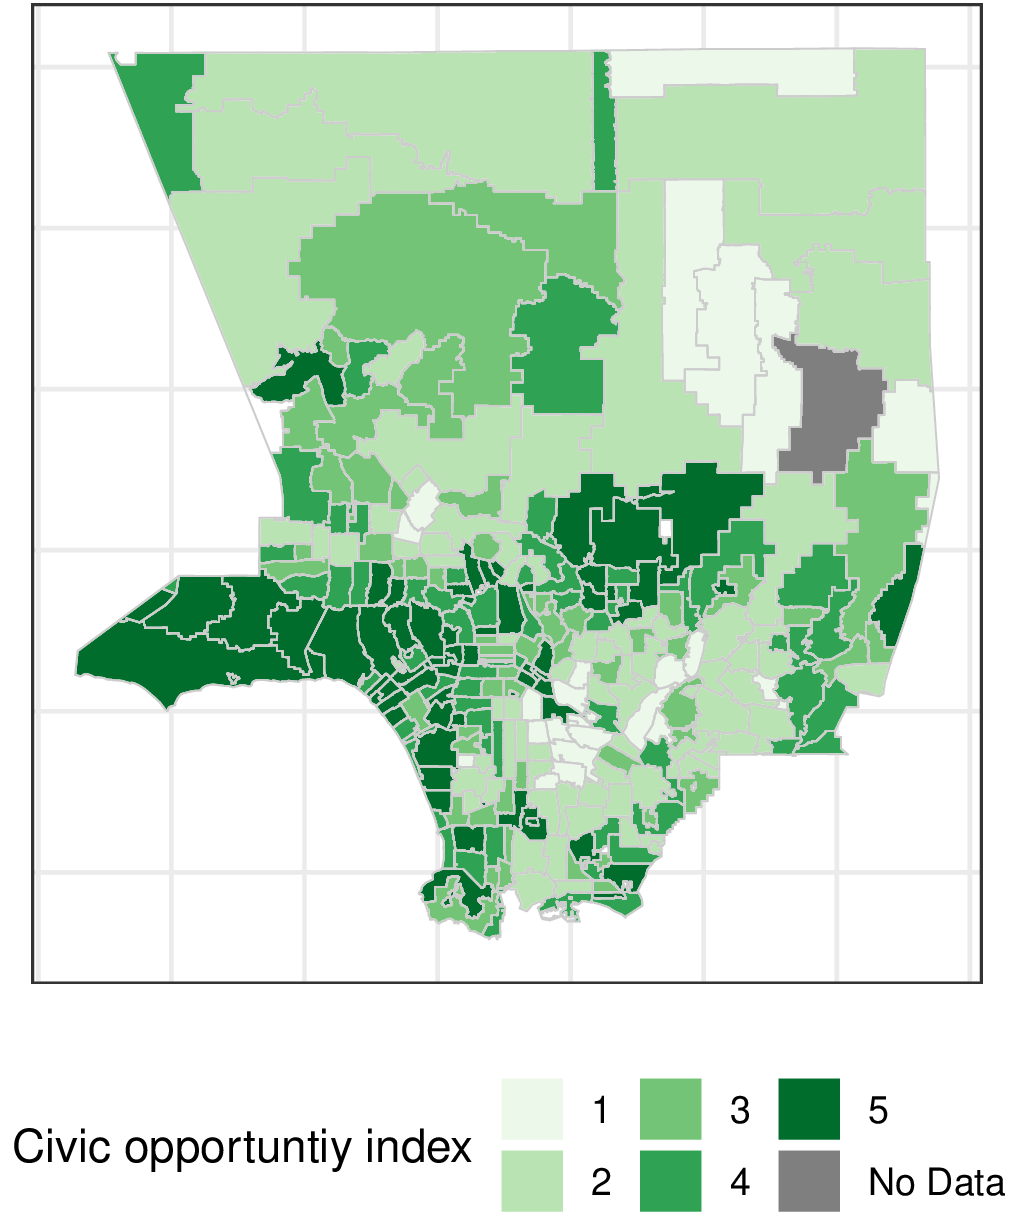
Finding No. 1 · The Unequal Distribution
The distribution of civic opportunity in America is unequal.
The map of civic opportunity shown here reveals an unequal landscape. For
instance, every county in states like Connecticut fall into the top two
quintiles of civic opportunity (4 or 5). By contrast, over 86% of counties
in Mississippi fall into the bottom two quintiles (1 or 2).
When we zoom in — here on the right we've focused on Los Angeles County,
for instance, and calculated the civic opportunity index by zip code — we
see that these disparities exist not only at the county level, but also at
more localized levels.
Civic opportunity index by zip code
Los Angeles County, California
02
Finding No. 2 · The Adversity Gap
Where need is greatest, civic infrastructure is thinnest.
Across every measure of disadvantage tracked in the dataset — poverty,
unemployment, single-parent households, the broadband gap, adults without a
high-school diploma — the relationship with civic opportunity runs in the
same direction: down.
The strongest signal is education. Counties where more adults lack a high-school
diploma have substantially fewer civic opportunities per capita — a correlation
of −0.45. The places that arguably need the most civic infrastructure to mediate
between residents and institutions tend to have the least of it. This is not a
coincidence to dismiss; it is a structural finding to address.
Correlation with civic opportunity score
Pearson r across 3,126 counties · negative bars run left
03
Finding No. 3 · The Impact
Where civic opportunity exists predicts where civic action happens.
We also find that this patterned inequality in civic opportunity is related to indicators of a
community’s ability to come together to solve shared problems. Communities with limited civic
opportunities may lack the necessary infrastructure to take collective action when it is most
needed. The emergence of mutual aid in response to the coronavirus pandemic is a good
example, as it illustrates people's willingness to take actions that assist their community
members.
We found that there's significant connection, at the county level, between civic opportunity
and the emergence of COVID-19 mutual aid organizations during the global coronavirus
pandemic of 2020-2021 in which counties with higher per capita civic opportunity scores were
more likely to have mutual aid organizations emerge during the pandemic. This connection is
predicted by our civic opportunity measure, but not by other common measures of community health
such as social capital.
The association between civic opportunity and the emergence of mutual aid
COVID-19 mutual aid hubs and civic opportunity per county

04
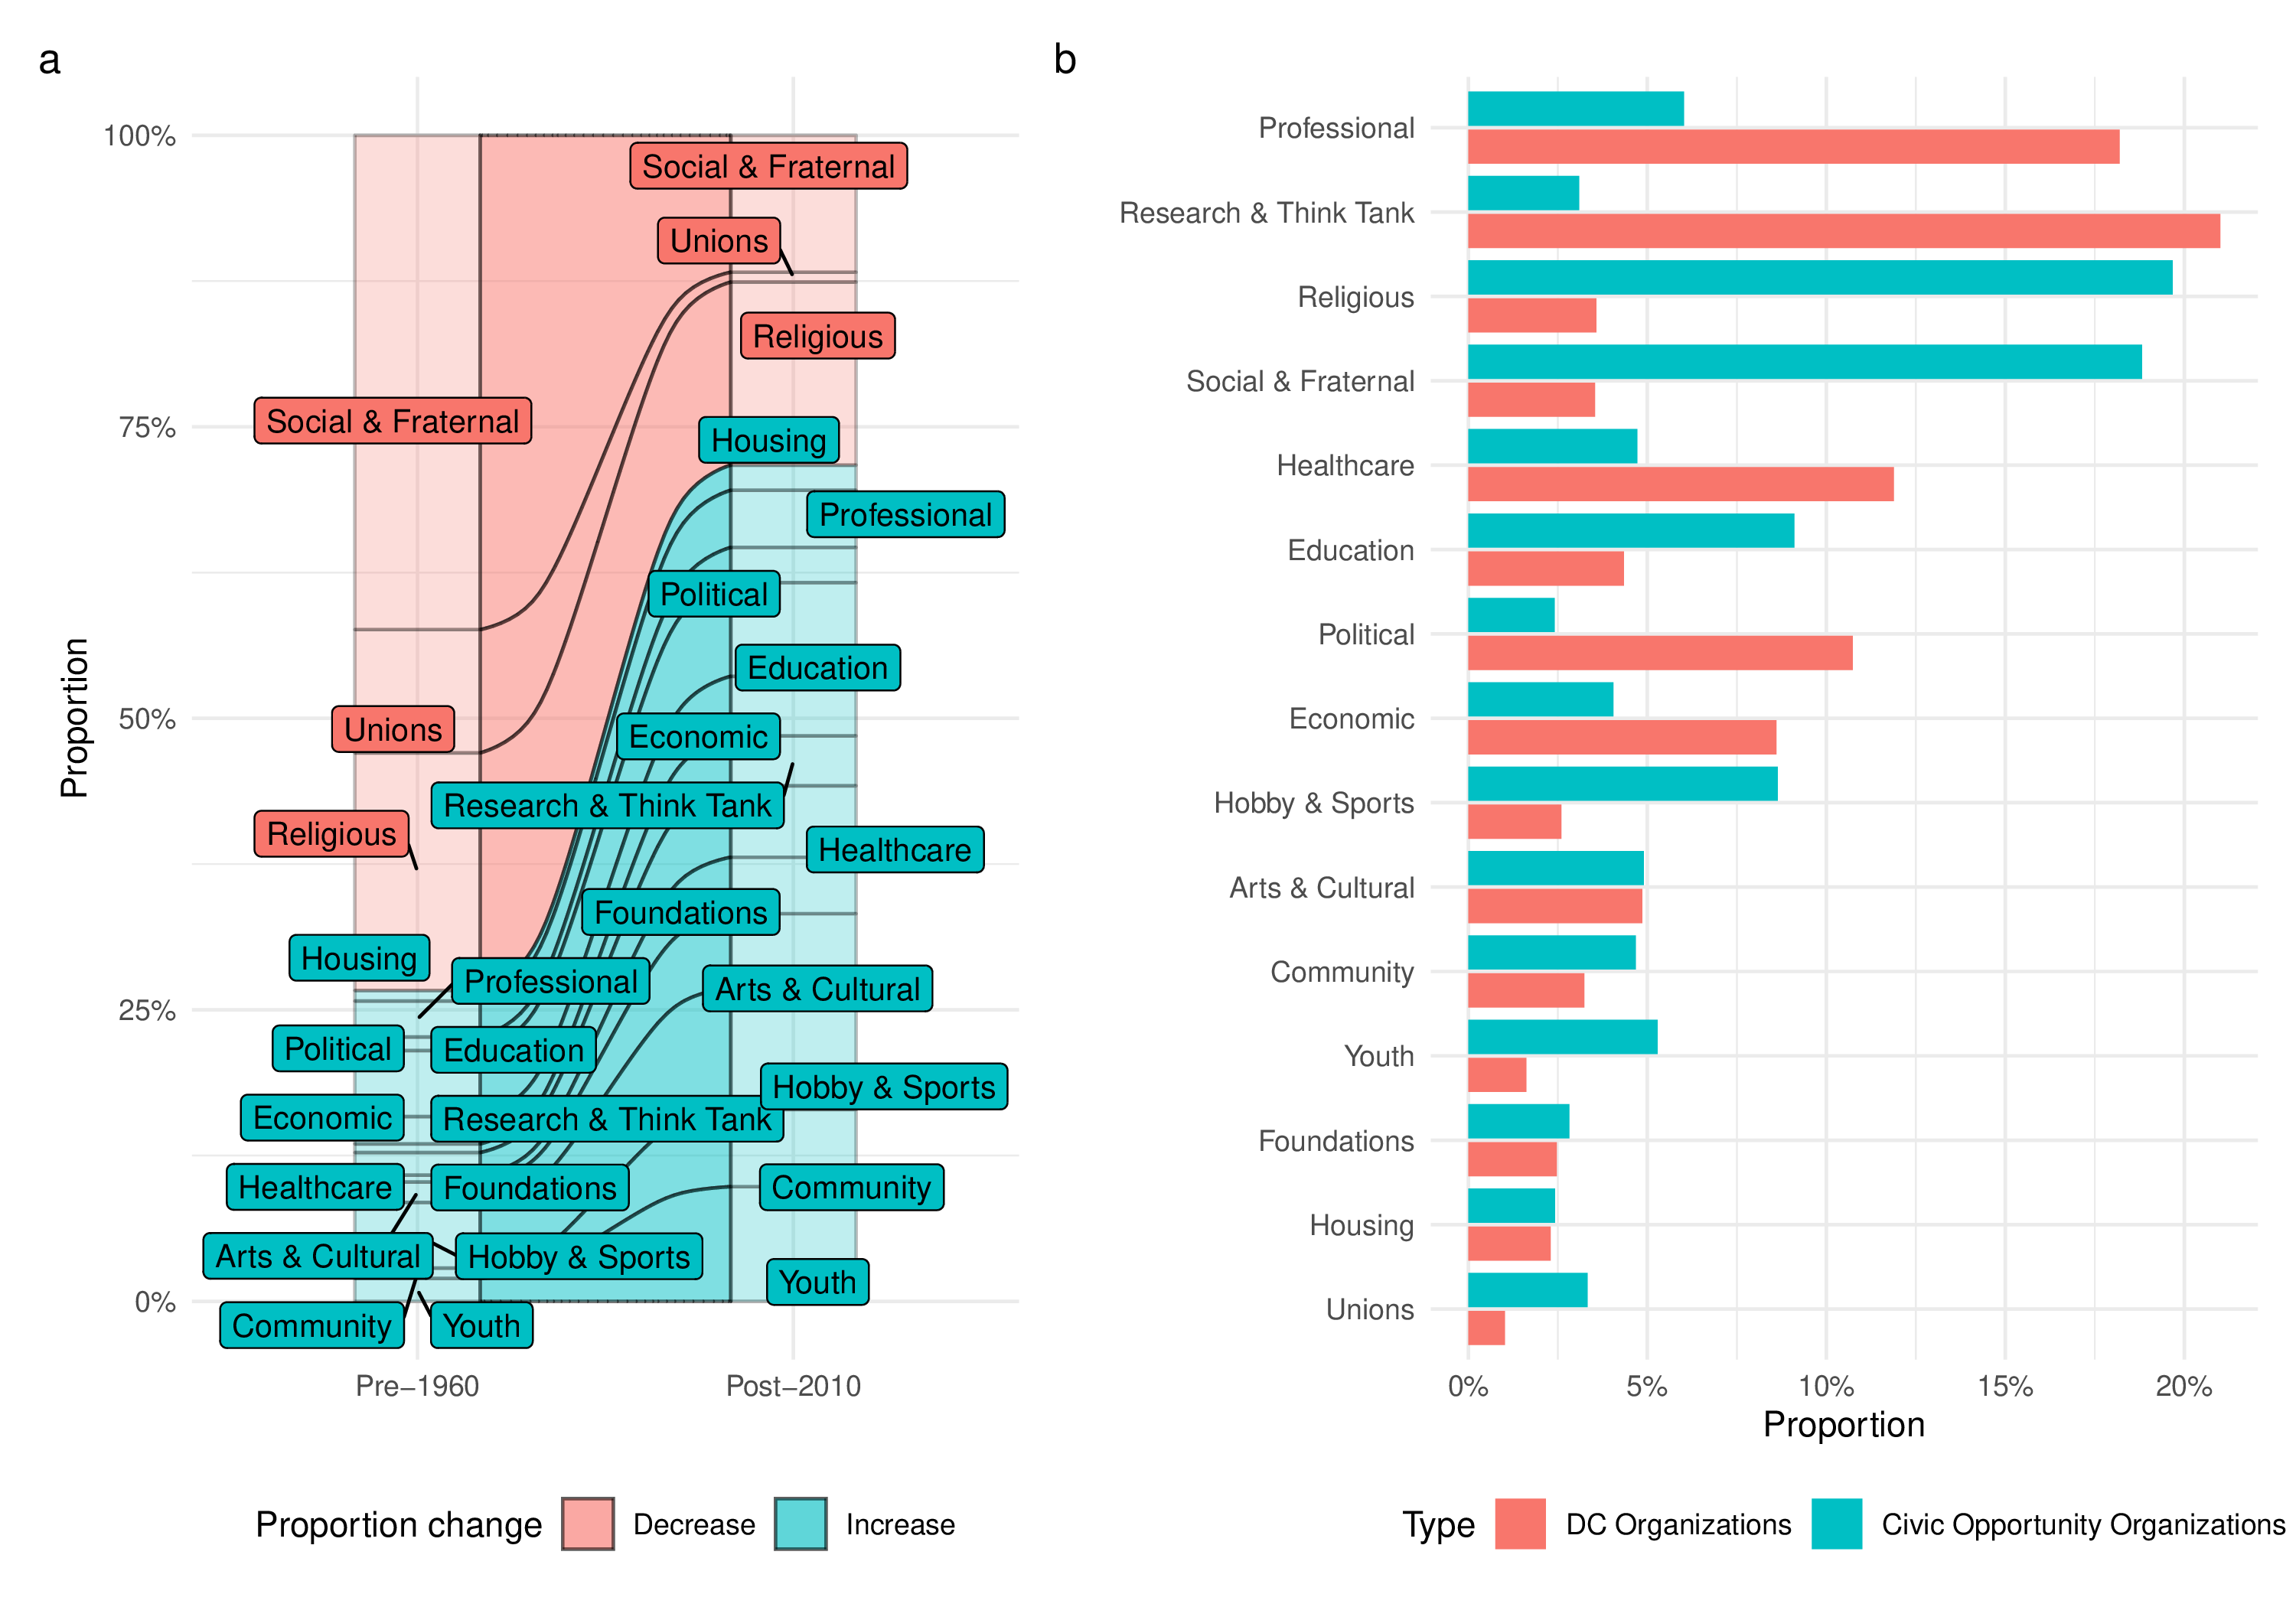
Finding No. 4 · The Composition
The organizations holding civic life together are changing.
One potential reason civic opportunity may have become so uneven
is because there is a mismatch between the types of organizations
producing civic opportunity and the types of organizations that get
public attention. In our data, the most common organizations provid-
ing civic opportunity across America are Social & Fraternal organiza-
tions (Rotary Clubs, fraternities, sororities, ethnic clubs and so on)
and Religious (churches, temples, mosques and so on) organizations.
In 85% of counties, they are the top providers of civic opportunity.
Yet, the landscape of civic opportunity providers has shifted. Social-fraternal
and religious organizations went from 62% of civic opportunity
providers among organizations founded before 1960 to 28% among those founded
after 2010. In addition, the kinds of organizations providing civic
opportunity in communities are strikingly different from those represented in
Washington DC.
Sources of Civic Opportunity
Historical shift and comparison to Wasington D.C.